
With Carlton and Essendon currently sitting in the top 8, I got to wondering about the history of teams missing the finals in one year and then making it the next. For this first analysis it made sense to choose the period 1997 to 2008 as this is the time during which we've had the same 16 teams as we do now.
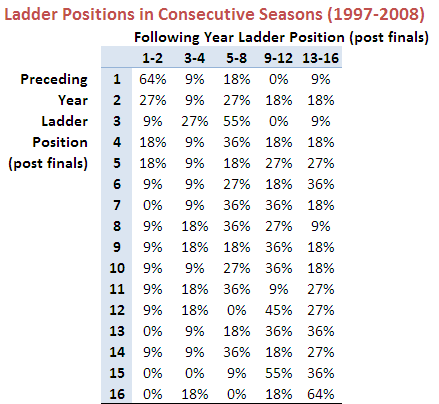
For that period, as it turns out, the chances are about 1 in 3 that a team finishing 9th or worse in one year will make the finals in the subsequent year. Generally, as you'd expect, the chances improve the higher up the ladder that the team finished in the preceding season, with teams finishing 11th or higher having about a 50% chance of making the finals in the subsequent year.
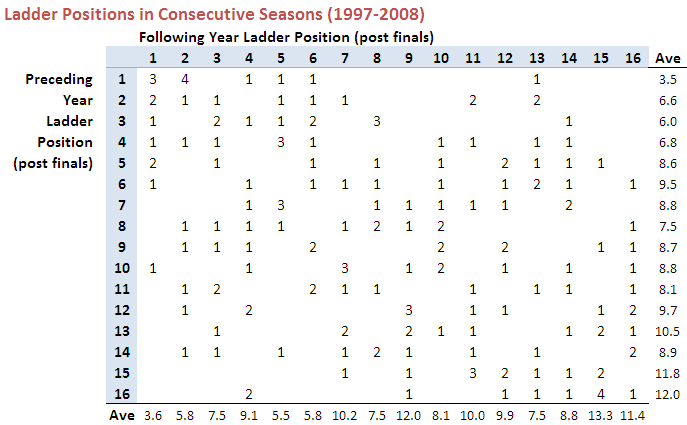
Here's the data I've been using for the analysis so far:
And here's that same data converted into row percentages and grouping the Following Year ladder positions.
Note that in these tables I've used each team's final ladder position, not their ladder position as at the end of the home and away season. So, for example, Geelong's 2008 ladder position would be 2nd, not 1st.
Teams that make the finals in a given year have about a 2 in 3 chance of making the finals in the following year. Again, this probability tends to increase with higher ladder position: teams finishing in the top 4 places have a better than 3 in 4 record for making the subsequent year's finals.
One of the startling features of these tables is just how much better flag winners perform in subsequent years than do teams from any other position. In the first table, under the column headed "Ave" I've shown the average next-season finishing position of teams finishing in any given position. So, for example, teams that win the flag, on average, finish in position 3.5 on the subsequent year's ladder. This average is bolstered by the fact that 3 of the 11 (or 27%) premiers have gone back-to-back and 4 more (another 36%) have been losing Grand Finalists. Almost 75% have finished in the top 4 in the subsequent season.
Dropping down one row we find that the losing Grand Finalist from one season fares much worse in the next season. Their average ladder position is 6.6, which is over 3 ladder spots lower than the average for the winning Grand Finalist. Indeed, 4 of the teams that finished 2nd in one season missed the finals in the subsequent year. This is true of only 1 winning Grand Finalist.
In fact, the losing Grand Finalists don't tend to fare any better than the losing Preliminary Finalists, who average positions 6.0 (3rd) and 6.8 (4th).
The next natural grouping of teams based on average ladder position in the subsequent year seems to be those finishing 5th through 11th. Within this group the outliers are teams finishing 6th (who've tended to drop 3.5 places in the next season) and teams finishing 9th (who've tended to climb 1.5 places).
The final natural grouping includes the remaining positions 12th through 16th. Note that, despite the lowly average next-year ladder positions for these teams, almost 15% have made the top 4 in the subsequent year.
A few points of interest on the first table before I finish:
* Only one team that's finished below 6th in one year has won the flag in the next season: Geelong, who finished 10th in 2006 and then won the flag in 2007
* The largest season-to-season decline for a premier is Adelaide's fall from the 1998 flag to 13th spot in 1999.
* The largest ladder climb to make a Grand Final is Melbourne's rise from 14th in 1999 to become losing Grand Finalists to Essendon in 2000.
Next time we'll look at a longer period of history.

No comments:
Post a Comment