It's based on the general premise that a team's rating should be proportional to the sum of the ratings of the teams that it has defeated. In the variant that I've used, each team's rating is proportional to the rating of those teams it has defeated on each occasion that it has faced them in a given season plus one-half of the rating of those teams with which it has drawn if they played only once, or with which it has won once and lost once if they have played twice during the season.
(Note that I've used only regular home-and-away season games for these ratings and that I've made no allowance for home team advantage.)
This method produces relative, not absolute, ratings so we can arbitrarily set any one team's rating - say the strongest team's - to be 1, and then define every other team's rating relative to this. All ratings are non-negative.
Using the system requires some knowledge of matrix algebra, but that's about it. (For the curious, the ratings involve solving the equation Ax = kx where A is a symmetric matrix with 0s on the diagonal and where Aij is the proportion of games between teams i and j that were won by i and Aji = 1 - Aij; x is the ratings vector; and k is a constant. The solution for x that we want is the first-rank eigenvector of A. We normalise x by dividing each element by the maximum element in x.)
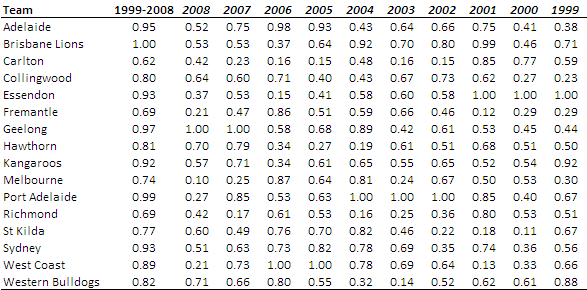
Applying this technique to the home-and-away games of the previous 10 seasons, we obtain the following ratings:

Now bear in mind that it makes little sense to directly compare ratings across seasons, so a rating of, say, 0.8 this year means only that the team was in some sense 80% as good as the best team this year; it doesn't mean that the team was any better or worse than a team rating 0.6 last year unless you're willing to make some quantitative assumption about the relative merits of this year's and last year's best teams.
What we can say with some justification however is that Geelong was stronger relative to Port in 2007 than was Geelong relative to the Hawks in 2008, The respective GFs would seem to support this assertion.
So, looking across the 10 seasons, we find that:
Perhaps most important of all we can say that the Brisbane Lions are the Team of the Decade.
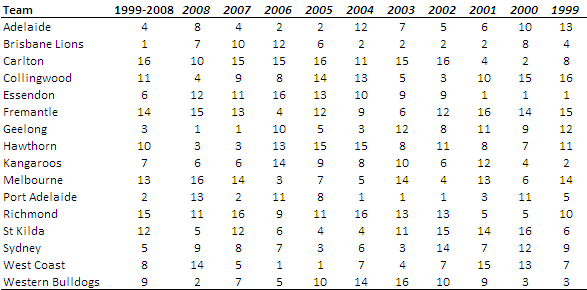
Here is the ratings table above in ranking form:

What's interesting about these rankings from a Brisbane Lions point of view is that only twice has its rating been 10th or worse. Of particular note is that, in seasons 2005 and 2008, Brisbane rates in the top 8 but did not make the finals. In 2008 the Lions won all their encounters against 3 of the finalists and shared the honours with 2 more, so there seems to be some justification for their lofty 2008 rating at least.
Put another way, based on the ratings, Brisbane should have participated in all but 2 of the past 10 final series. No other team can make that claim.
Second-best Team of the Decade is Port Adelaide, who registered 3 consecutive Highest Rated Team across seasons 2002, 2003 and 2004. Third-best is Geelong, largely due to their more recent performance, which has seen them amongst the top 5 teams in all but 1 of the previous 5 seasons.
The Worst Team of the Decade goes to Carlton, who've finished ranked 10th or below in each of the previous 7 seasons. Next worst is Richmond who have a similar record blemished only by a 9th-placed finish in 2006.

