Wednesday, February 25, 2009

Which Quarter Do Winners Win?

Today we'll revisit yet another chestnut and we'll analyse a completely new statistic.

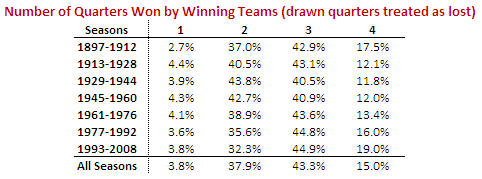
First, the chestnut:  which quarter do winning teams win most often? You might recall that for the previous four seasons the answer has been the 3rd quarter, although it was a very close run thing last season, when the results for the 3rd and 4th quarters were nearly identical.

How then does the picture look if we go back across the entire history of the VFL/AFL?


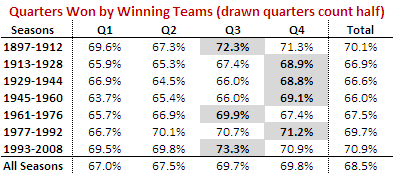
It turns out that the most recent epoch, spanning the seasons 1993 to 2008, has been one in which winning teams have tended to win more 3rd quarters than any other quarter. In fact, it was the quarter won most often in nine of those 16 seasons.

This, however, has not at all been the norm. In four of the other six epochs it has been the 4th quarter that winning teams have tended to win most often. In the other three epochs the 4th quarter has been the second most commonly won quarter.

But, the 3rd quarter has rarely been far behind the 4th, and its resurgence in the most recent epoch has left it narrowly in second place in the all-time statistics.

A couple of other points are worth making about the table above. Firstly, it's interesting to note how significantly more frequently winning teams are winning the 1st quarter than they have tended to in epochs past. Successful teams nowadays must perform from the first bounce.

Secondly, there's a clear trend over the past 4 epochs for winning teams to win a larger proportion of all quarters, from about 66% in the 1945 to 1960 epoch to almost 71% in the 1993 to 2008 epoch.

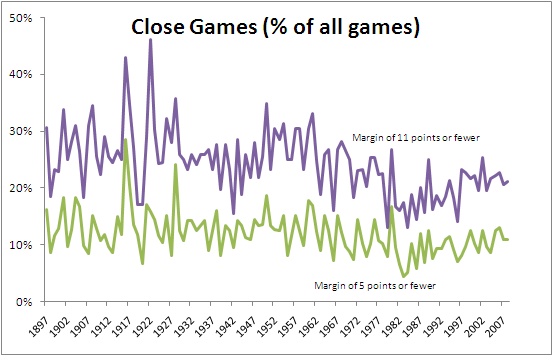
Now on to something a little different. While I was conducted the previous analysis, I got to wondering if there'd ever been a team that had won a match in which in had scored more points than its opponent in just a solitary quarter. Incredibly, I found that it's a far more common occurrence than I'd have estimated.


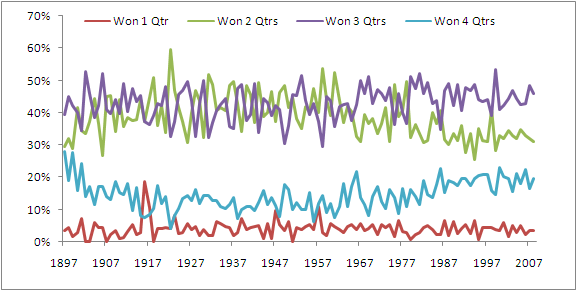
The red line shows, for every season, the percentage of games in which the winner won just a solitary quarter (they might or might not have drawn any of the others). The average percentage across all 112 seasons is 3.8%. There were five such games last season, in four of which the winner didn't even manage to draw any of the other three quarters. One of these games was the Round 19 clash between Sydney and Fremantle in which Sydney lost the 1st, 2nd and 4th quarters but still got home by 2 points on the strength of a 6.2 to 2.5 3rd term.

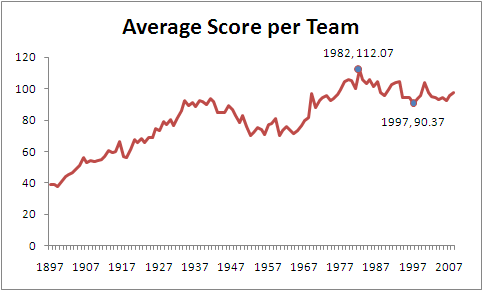
You can also see from the chart the upward trend since about the mid 1930s in the percentage of games in which the winner wins all four quarters, which is consistent with the general rise, albeit much less steadily, in average victory margins over that same period that we saw in an earlier blog.

To finish, here's the same data from the chart above summarised by epoch:


Monday, February 16, 2009

Is the Competition Getting More Competitive?

We've talked before about the importance of competitiveness in the AFL and the role that this plays in retaining fans' interest because they can legitimately believe that their team might win this weekend (Melbourne supporters aside).

Last year we looked at a relatively complex measure of competitiveness that was based on the notion that competitive balance should produce competition ladders in which the points are spread across teams rather than accruing disproportionately to just a few. Today I want to look at some much simpler diagnostics based on margins of victory.

Firstly, let's take a look at the average victory margin per game across every season of the VFL/AFL.


The trend since about the mid 1950s has been increasing average victory margins, though this seems to have been reversed at least a little over the last decade or so. Notwithstanding this reversal, in historical terms, we saw quite high average victory margins in 2008. Indeed, last year's average margin of 35.9 points was the 21st highest of all time.

Looking across the last decade, the lowest average victory margin came in 2002 when it was only 31.7 points, a massive 4 points lower than we saw last year. Post WWII, the lowest average victory margin was 23.2 points in 1957, which was the season in which Melbourne took the minor premiership with 12-1-5 record.

Averages can, of course, be heavily influenced by outliers, in particular by large victories. One alternative measure of the closeness of games that avoids these outliers is the proportion of games that are decided by less than a goal or two. The following chart provides information about such measures. (The purple line shows the percentage of games won by 11 points or fewer and the green line shows the percentage of games won by 5 points or fewer. Both include draws.)


Consistent with what we found in the chart of average victory margins we can see here a general trend towards fewer close games since about the mid 1950s. We can also see an increase in the proportion of close games in the last decade.

Again we also find that, in historical terms, the proportion of close games that we're seeing is relatively low. The proportion of games that finished with a margin of 5 points or fewer in 2008 was just 10.8%, which ranks equal 66th (from 112 seasons). The proportion that finished with a margin of 11 points or fewer was just 21.1%, which ranks an even lowlier 83rd.

On balance then I think you'd have to conclude that the AFL competition is not generally getting closer though there are some signs that the situation has been improving in the last decade or so.

Thursday, February 12, 2009

Winners' Share of Scoring

You might recall from seasons past my commenting on what I've claimed to be a startling regularity in AFL scoring, specifically, the proportion of scoring shots recorded by winning teams.

In 2008, winning teams racked up 57.3% of all scoring shots, while in 2007 the figure was 56.6%, and in 2006 it was 56.7%. Across the period 1999 to 2008 this percentage bounced around in a range between 56.4% and 57.8%. By any standard that's remarkable regularity.

I've recently come into possession of the scores for the entire history of the VFL/AFL competition in a readily analysable form - and by now you surely now how dangerous that's gotta be - so it seemed only natural to see if this regularity persisted into earlier seasons (assuming that it makes sense for something to persist into the past).

Below is a chart showing (in purple) the percentage of scoring shots registered by winning teams in each of the seasons 1897 through 2008. (The red line shows the proportion of goals that they scored, and the green line shows the proportion of behinds.)


So, apart from the more extreme dominance of winning teams in the first decade or so of the competition, and a few other aberrant seasons over the next two decades, we have certainly seen remarkable stability in the percentage we've been discussing. Indeed, in the period 1927 to 2008, the percentage of scoring shots registered by winning teams has never been outside the range 55.0% to 59.6%. That surely almost establishes this phenomenon as a Law of Footy.

For those of you who prefer to digest your data in tabular form (preferably taken with meals), here's a decade-by-decade summary of the data.


The recent peak in winning teams' share of scoring was witnessed in 1995 and it came not as a consequence of a spike in 6-pointer dominance but instead from a spike in winning teams' share of behinds. In 1995 winning teams scored 57% of all behinds, which is about 2-4% higher than anything we've witnessed since. 1995 was the year that Carlton won the minor premiership kicking 317 behinds, Geelong finished runners-up kicking 338, and Richmond and Essendon, finishing in 3rd and 4th, kicked 600 more between them. By way of context, that's almost 75 more behinds than the top 4 of Geelong, Hawthorn, Western Bulldogs and St Kilda managed in 2008.

Regularity also aptly describes the history of the percentage of goals kicked by winning teams across the seasons (the red line in the chart). Again looking at the entire period since 1927, this percentage has never strayed from the righteous range of 57.0% to 61.8%.

Winning teams' share of behinds (the green line) has been, relatively speaking, quite variable, ranging from 51.9% to 58.2% in the period 1927 to the present, which once again demonstrates that it's goals and not behinds that win footy games.

Friday, February 6, 2009

A Little AFL/VFL History

Every so often this year I'll be diving into the history of the VFL/AFL to come up with obscure and conversation-stopping facts for you to use at the next social event you attend.

For example, do you know the most common score in AFL history? It's 12.12 (84) and has been a team's final score about 0.88% of the time (counting two scores for each game in the denominator for that percentage). What if we restrict our attention to more recent seasons, say 1980 to 2008? It's 12.12 again (84), only now its prevalence is 0.98%. Last year though we managed only a single 12.12 (84) score, courtesy of St Kilda in Round 14.

While we're on the topic of scores, which season do you think produced the highest average score per team? It was 1982 and the average was 112.07 points. The trend since that season has been steadily downwards with the nadir being in 1997 when the average was 90.37 points.


From season averages to individual game scores, here are a couple of doozies. In May of 1919, Geelong took on St Kilda in a Round 5 clash at Corio Oval. The first quarter failed to produce a goal from either team and saw Geelong lead 0.6 to 0.2. St Kilda found their range - relatively speaking - in the second quarter to lead 3.4 to 0.9 at the main break. One need speculate only briefly about the thrust of the Cats' half-time speech from the coach. 

The speech clearly didn't help, however, as Geelong continued to accumulate only singles for the remaining two quarters, finally emerging goal-less and defeated, 0.18 to 6.10.

Just over two years later, in July of 1921, St Kilda swapped roles and matched the Cats' ineptitude, eventually going down 0.18 to Fitzroy's 6.8 in front of around 6,000 startled fans.

If you're looking for more sustained inaccuracy you'd be after the South Melbourne team of 1900. They managed 59.127 for the entire season, a 31.7% accuracy rate.

In contrast, in 1949 the Hawks put on a spectacular display of straight kicking at Glenferrie Oval, finishing with 7.0 for the game. Regretably, their opponents, Essendon, clearly with no sense of aesthetics, repeatedly sprayed the ball at goal finishing 70 point victors by bagging a woefully inaccurate 16.16.

Again, turning from the single game to an entire season, plaudits must go to the St Kilda team of 2004, who registered 409.253 or 61.8% for the season. But, as the Hawks discovered, accuracy does not preordain success: St Kilda went out in the Preliminary Final to Port by 6 points.