Thursday, April 23, 2009

Losing Does Lead to Winning But Only for Home Teams (and only sometimes)

For reasons that aren't even evident to me, I decided to revisit the issue of "when losing leads to winning", which I looked at a few blogs back.

In that earlier piece no distinction was made between which team - home or away - was doing the losing or the winning. Such a distinction, it turns out, is important in uncovering evidence for the phenomenon in question. 

Put simply, there is some statistical evidence across the home-and-away matches from 1980 to 2008 that home teams that trail by between 1 and 4 points at quarter time, or by 1 point at three-quarter time, tend to win more often than they lose. There is no such statistical evidence for away teams.

The table below shows the proportion of times that the home team has won when leading or trailing by the amount shown at quarter time, half time or three-quarter time. 


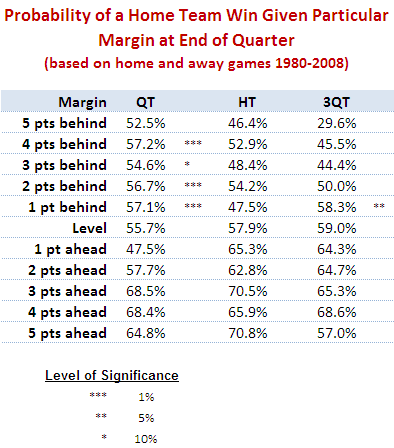
It shows, for example, that home teams that trailed by exactly 5 points at quarter time went on to win 52.5% of such games.

Using standard statistical techniques I've been able to determine, based on the percentages in the table and the number of games underpinning each percentage, how likely it is that the "true" proportion of wins by the home team is greater than 50% for any of the entries in the table for which the home team trails. That analysis, for example, tells us that we can be 99% confident (since the significance level is 1%) that the figure of 57.2% for teams trailing by 4 points at quarter time is statistically above 50%.

(To look for a losing leads to winning phenomenon amongst away teams I've performed a similar analysis on the rows where the home team is ahead and tested whether the proportion of wins by the home team is statistically significantly less than 50%. None of the entries was found to be significant.)

My conclusion then is that, in AFL, it's less likely that being slightly behind is motivational. Instead, it's that the home ground advantage is sufficient for the home team to overcome small quarter time or three-quarter time deficits. It's important to make one other point: though home teams trailing do, in some cases, win more often that they lose, they do so at a rate less than their overall winning rate, which is about 58.5%.

So far we've looked only at narrow leads and small deficits. While we're here and looking at the data in this way, let's broaden the view to consider all leads and deficits.


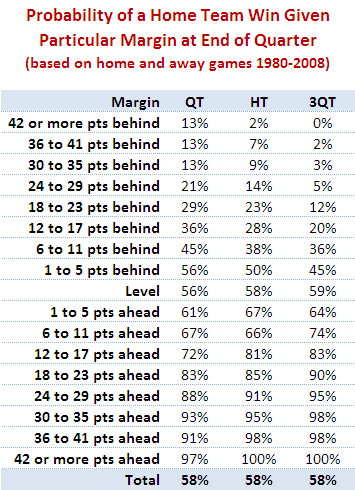
In this table I've grouped leads and deficits into 5-point bands. This serves to iron out some of the bumps we saw in the earlier, more granular table.

A few things strike me about this table:
* Home teams can expect to overcome a small quarter time deficit more often than not and need only be level at the half or at three-quarter time in order to have better than even chances of winning. That said, even the smallest of leads for the away team at three-quarter time is enough to shift the away team's chances of victory to about 55%.
* Apparently small differences have significant implications for the outcome. A late goal in the third term to extend a lead from say 4 to 10 points lifts a team's chances - all else being equal - by 10% points if it's the home team (ie from 64% to 74%) and by an astonishing 16% points if it's the away team (ie from 64% to 80%).
* A home team that leads by about 2 goals at the half can expect to win 8 times out of 10. An away team with such a lead with a similar lead can expect to win about 7 times out of 10.

Sunday, April 19, 2009

From One Year To The Next: Part 2

Last blog I promised that I'd take another look at teams' year-to-year changes in ladder position, this time taking a longer historical perspective.

For this purpose I've elected to use the period 1925 to 2008 as there have always been at least 10 teams in the competition from that point onwards. Once again in this analysis I've used each team's final ladder position, not their ladder position as at the end of the home and away season. Where a team has left or joined the competition in a particular season, I've omitted its result for the season in which it came (since there's no previous season) or went (since there's no next season). 

As the number of teams making the finals has varied across the period we're considering, I'll not be drawing any conclusions about the rates of teams making or missing the finals. I will, however, be commenting on Grand Final participation as each season since 1925 has culminated in such an event.  

Here's the raw data:


(Note that I've grouped all ladder positions of 9th or lower in the "9+" category. In some years this incorporates just two ladder positions, in others as many as eight.)

A few things are of note in this table:
* Losing Grand Finalists are more likely than winning Grand Finalists to win in the next season.
* Only 10 of 83 winning Grand Finalists finished 6th or lower in the previous season.
* Only 9 of 83 winning Grand Finalists have finished 7th or lower in the subsequent season.
* The average ladder position of a team next season is highly correlated with its position in the previous season. One notable exception to this tendency is for teams finishing 4th. Over one quarter of such teams have finished 9th or worse in the subsequent season, which drags their average ladder position in the subsequent year to 5.8, below that of teams finishing 5th.
* Only 2 teams have come from 9th or worse to win the subsequent flag - Adelaide, who won in 1997 after finishing 12th in 1996; and Geelong, who won in 2007 after finishing 10th in 2006.
* Teams that finish 5th have a 14-3 record in Grand Finals that they've made in the following season. In percentage terms this is the best record for any ladder position.

Here's the same data converted into row percentages.


Looking at the data in this way makes a few other features a little more prominent:
* Winning Grand Finalists have about a 45% probability of making the Grand Final in the subsequent season and a little under a 50% chance of winning it if they do.
* Losing Grand Finalists also have about a 45% probability of making the Grand Final in the subsequent season, but they  have a better than 60% record of winning when they do.
* Teams that finish 3rd have about a 30% chance of making the Grand Final in the subsequent year. They're most likely to be losing Grand Finalists in the next season.
* Teams that finish 4th have about a 16% chance of making the Grand Final in the subsequent year. They're most likely to finish 5th or below 8th. Only about 1 in 4 improve their ladder position in the ensuing season.
* Teams that finish 5th have about a 20% chance of making the Grand Final in the subsequent year. These teams tend to the extremes: about 1 in 6 win the flag and 1 in 5 drops to 9th or worse. Overall, there's a slight tendency for these teams to drop down the ladder.
* Teams that finish 6th or 7th have about a 20% chance of making the Grand Final in the subsequent year. Teams finishing  6th tend to drop down the ladder in the next season; teams finishing 7th tend to climb.
* Teams that finish 8th have about a 8.5% chance of making the Grand Final in the subsequent year. These teams tend to climb in the ensuing season.
* Teams that finish 9th or worse have about a 3.5% chance of making the Grand Final in the subsequent year. They also have a roughly 2 in 3 chance of finishing 9th or worse again.

So, I suppose, relatively good news for Cats fans and perhaps surprisingly bad news for St Kilda fans. Still, they're only statistics.

Tuesday, April 14, 2009

From One Year To The Next: Part 1

With Carlton and Essendon currently sitting in the top 8, I got to wondering about the history of teams missing the finals in one year and then making it the next. For this first analysis it made sense to choose the period 1997 to 2008 as this is the time during which we've had the same 16 teams as we do now.

For that period, as it turns out, the chances are about 1 in 3 that a team finishing 9th or worse in one year will make the finals in the subsequent year. Generally, as you'd expect, the chances improve the higher up the ladder that the team finished in the preceding season, with teams finishing 11th or higher having about a 50% chance of making the finals in the subsequent year.

Here's the data I've been using for the analysis so far:


And here's that same data converted into row percentages and grouping the Following Year ladder positions.


Note that in these tables I've used each team's final ladder position, not their ladder position as at the end of the home and away season. So, for example, Geelong's 2008 ladder position would be 2nd, not 1st.

Teams that make the finals in a given year have about a 2 in 3 chance of making the finals in the following year. Again, this probability tends to increase with higher ladder position: teams finishing in the top 4 places have a better than 3 in 4 record for making the subsequent year's finals.

One of the startling features of these tables is just how much better flag winners perform in subsequent years than do teams from any other position. In the first table, under the column headed "Ave" I've shown the average next-season finishing position of teams finishing in any given position. So, for example, teams that win the flag, on average, finish in position 3.5 on the subsequent year's ladder. This average is bolstered by the fact that 3 of the 11 (or 27%) premiers have gone back-to-back and 4 more (another 36%) have been losing Grand Finalists. Almost 75% have finished in the top 4 in the subsequent season.

Dropping down one row we find that the losing Grand Finalist from one season fares much worse in the next season. Their average ladder position is 6.6, which is over 3 ladder spots lower than the average for the winning Grand Finalist. Indeed, 4 of the teams that finished 2nd in one season missed the finals in the subsequent year. This is true of only 1 winning Grand Finalist.

In fact, the losing Grand Finalists don't tend to fare any better than the losing Preliminary Finalists, who average positions 6.0 (3rd) and 6.8 (4th).

The next natural grouping of teams based on average ladder position in the subsequent year seems to be those finishing 5th through 11th. Within this group the outliers are teams finishing 6th (who've tended to drop 3.5 places in the next season) and teams finishing 9th (who've tended to climb 1.5 places).

The final natural grouping includes the remaining positions 12th through 16th. Note that, despite the lowly average next-year ladder positions for these teams, almost 15% have made the top 4 in the subsequent year.

A few points of interest on the first table before I finish:
* Only one team that's finished below 6th in one year has won the flag in the next season: Geelong, who finished 10th in 2006 and then won the flag in 2007
* The largest season-to-season decline for a premier is Adelaide's fall from the 1998 flag to 13th spot in 1999.
* The largest ladder climb to make a Grand Final is Melbourne's rise from 14th in 1999 to become losing Grand Finalists to Essendon in 2000.

Next time we'll look at a longer period of history.

Friday, April 10, 2009

Does Losing Lead to Winning?

I was reading an issue of Chance News last night and came across the article When Losing Leads to Winning. In short, the authors of this journal article found that, in 6,300 or so most recent NCAA basketball games, teams that trailed by 1 point at half-time went on to win more games than they lost. This they attribute to "the motivational effects of being slightly behind".

Naturally, I wondered if the same effect existed for footy.

This first chart looks across the entire history of the VFL/AFL.


The red line charts the percentage of times that a team leading by a given margin at quarter time went on to win the game. You can see that, even at the leftmost extremity of this line, the proportion of victories is above 50%. So, in short, teams with any lead at quarter time have tended to win more than they've lost, and the larger the lead generally the greater proportion they've won. (Note that I've only shown leads from 1 to 40 points.)

Next, the green line charts the same phenomenon but does so instead for half-time leads. It shows the same overall trend but is consistently above the red line reflecting the fact that a lead at half-time is more likely to result in victory than is a lead of the same magnitude at quarter time. Being ahead is important; being ahead later in the game is more so.

Finally, the purple line charts the data for leads at three-quarter time. Once again we find that a given lead at three-quarter time is generally more likely to lead to victory than a similar lead at half-time, though the percentage point difference between the half-time and three-quarter lines is much less than that between the half-time and first quarter lines.

For me, one of the striking features of this chart is how steeply each line rises. A three-goal lead at quarter time has, historically, been enough to win around 75% of games, as has a two-goal lead at half-time or three-quarter time.

Anyway, there's no evidence of losing leading to winning if we consider the entire history of footy. What then if we look only at the period 1980 to 2008 inclusive?


Now we have some barely significant evidence for a losing leads to winning hypothesis, but only for those teams losing by a point at quarter time (where the red line dips below 50%). Of the 235 teams that have trailed by one point at quarter time, 128 of them or 54.5% have gone on to win. If the true proportion is 50%, the likelihood of obtaining by chance a result of 128 or more wins is about 8.5%, so a statistician would deem that "significant" only if his or her preference was for critical values of 10% rather than the more standard 5%.

There is certainly no evidence for a losing leads to winning effect with respect to half-time or three-quarter time leads.

Before I created this second chart my inkling was that, with the trend to larger scores, larger leads would have been less readily defended, but the chart suggests otherwise. Again we find that a three-goal quarter time lead or a two-goal half-time or three-quarter time lead is good enough to win about 75% of matches.

Not content to abandon my preconception without a fight, I wondered if the period 1980 to 2008 was a little long and that my inkling was specific to more recent seasons. So, I divided up the 112-season history in 8 equal 14-year epochs and created the following table.


The top block summarises the fates of teams with varying lead sizes, grouped into 5-point bands, across the 8 epochs. For example, teams that led by 1 to 5 points in any game played in the 1897 to 1910 period went on to win 55% of these games. Looking across the row you can see that this proportion has varied little across epochs never straying by more than about 3 percentage points from the all-season average of 54%.

There is some evidence in this first block that teams in the most-recent epoch have been better - not, as I thought, worse - at defending quarter time leads of three goals or more, but the evidence is slight.

Looking next at the second block there's some evidence of the converse - that is, that teams in the most-recent epoch have been poorer at defending leads, especially leads of a goal or more if you adjust for the distorting effect on the all-season average of the first two epochs (during which, for example, a four-goal lead at half-time should have been enough to send the fans to the exits).

In the third and final block there's a little more evidence of recent difficulty in defending leads, but this time it only relates to leads less than two goals at the final change.

All in all I'd have to admit that the evidence for a significant decline in the ability of teams to defend leads is not particularly compelling. Which, of course, is why I build models to predict football results rather than rely on my own inklings ...